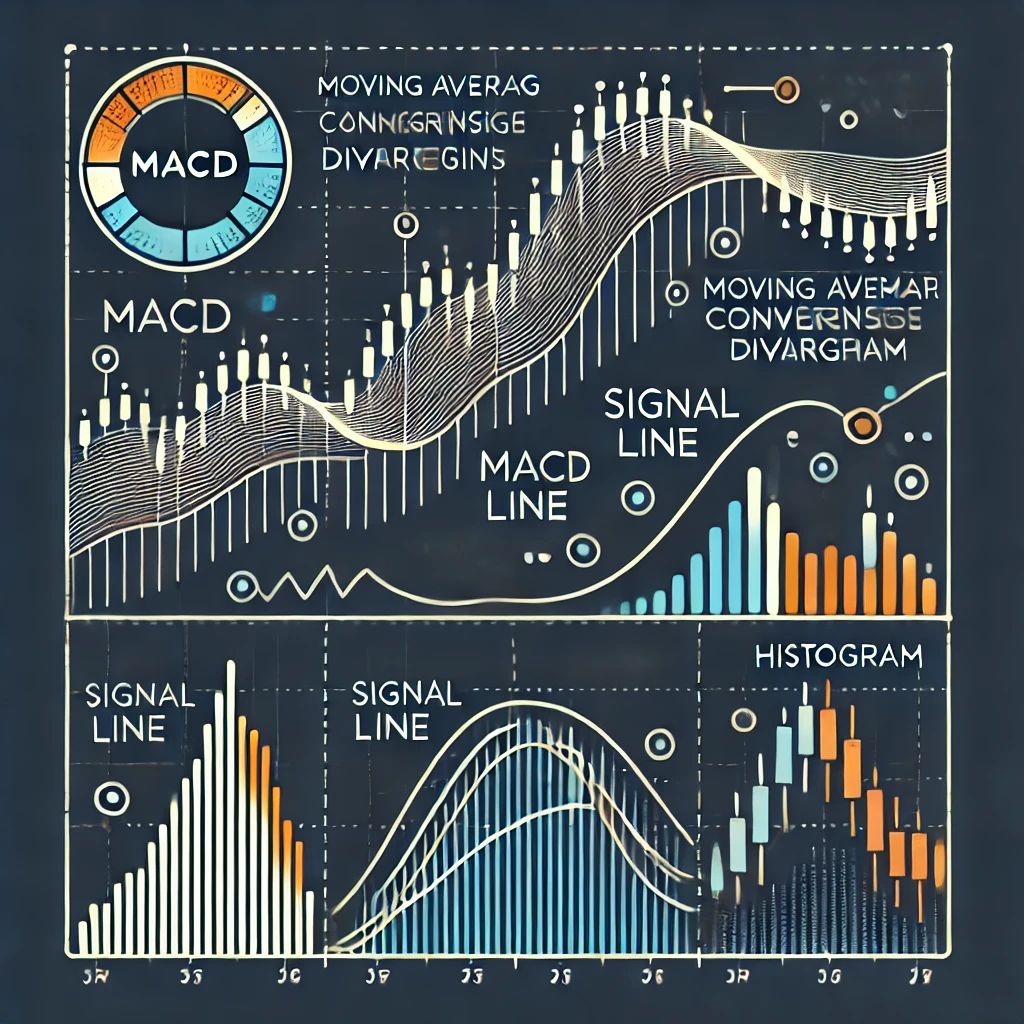
Starting your journey in cryptocurrency trading requires a strong foundation in key analytical concepts. Without understanding crucial elements like support and resistance levels, trend lines, and indicators, trading becomes chaotic and risky. Here are the four fundamental aspects to begin with:
1. Candlestick Analysis
2. Support and Resistance Levels
3. Trend Lines
4. Indicators and Volume
1. Candlestick Analysis: Visualizing the Market
Candlestick analysis is a cornerstone of technical analysis, offering insights into market sentiment and price movement. Beginners should start with 1-day or 12-hour timeframes to get a clearer view of the market’s overall state—whether it’s in a reversal phase or continuing its trend.
The most common candlestick patterns in the crypto market include:
• Hammer — signals a potential upward reversal.
• Hanging Man — indicates weakening trends.
• Inverted Hammer — suggests possible growth.
• Engulfing — a strong signal for trend reversal.
• Doji — a neutral signal requiring confirmation.
Volumes play a critical role here: for example, a “hammer” pattern accompanied by high trading volume has greater significance.
2. Support and Resistance Levels: Market’s Control Points
Support and resistance levels represent zones where price either slows down or reverses direction. The strength of these levels depends on three factors:
1. Duration of the Level
The more touches a level has and the longer it exists, the stronger it becomes. For instance, Bitcoin’s $6000 support level in 2018 was significant throughout the year.
2. Width of the Range
A wider price range makes the level stronger, as it accumulates energy in the consolidation zone.
3. Volume of Trades
High trading volume at a level indicates its importance to market participants. Conversely, low volume suggests weakness.
These factors help traders identify safer entry points with reduced risks.
3. Trend Lines: Understanding Price Direction
Trend lines are used to determine the market’s direction—whether it’s moving up, down, or sideways. They also help identify support and resistance zones.
In the crypto market, common patterns include:
• Triangles
• Flags and Pennants
• Head and Shoulders
• Double Tops and Double Bottoms
These patterns provide valuable insights into market sentiment and optimal entry or exit points.
4. Indicators and Volume: Additional Tools
Indicators are mathematical tools that help refine market signals. Here are some essential ones:
• Moving Average (MA): Shows the average price over a specific period.
• Relative Strength Index (RSI): Determines whether an asset is overbought or oversold.
• MACD: Combines trend and momentum indicators.
• Stochastic: Evaluates the market’s position relative to its price range.
Volume is equally important: if price movement isn’t backed by volume, it could indicate a false breakout.
Timeframes: The Foundation of Effective Analysis
Beginners should focus on timeframes from 1 to 4 hours to avoid mistakes caused by emotional decision-making when analyzing shorter intervals.
Trading Pairs: BTC or USD?
For beginners, trading pairs tied to USD are simpler to analyze, as they require fewer variables. BTC pairs demand additional considerations, including Bitcoin’s movement and its relationship with altcoins, making them more complex.
Fibonacci Numbers: The Science of Trading
Fibonacci levels are used to identify key support and resistance zones. To analyze, traders draw a “Fibonacci retracement” from the start to the end of a trend. Key levels (23.6%, 38.2%, 50%, 61.8%) help identify retracement zones or trend completion points.
In Bitcoin’s 2018 bear market, the 61.8% Fibonacci retracement level repeatedly proved its importance during corrections. Combining Fibonacci with other tools enhances trading accuracy.
Conclusion: The Synergy of Tools
Technical analysis doesn’t guarantee success, but proper use of its elements increases the likelihood of profitable trades. Master candlestick analysis, levels, indicators, and trend lines to create a comprehensive strategy.
Effective trading requires discipline, analytical skills, and continuous learning.


