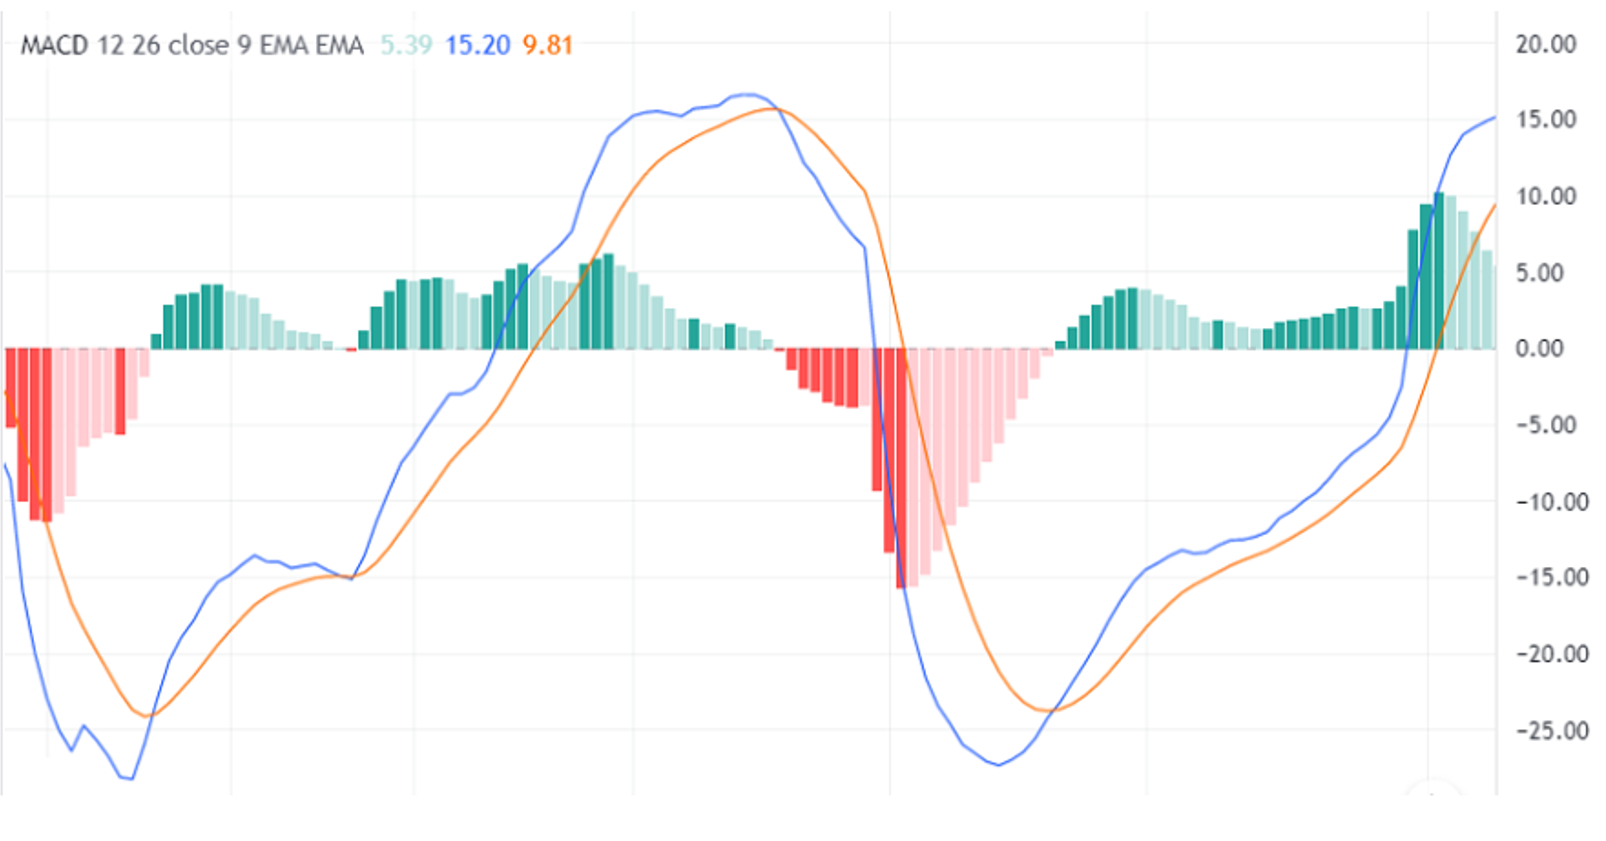
What is MACD?
MACD (Moving Average Convergence Divergence) is a widely used technical indicator designed for analyzing market trends and potential reversals. It combines the characteristics of a trend-following indicator and an oscillator, making it a versatile tool for traders.
The MACD indicator helps traders identify:
• Current market trends (bullish or bearish);
• The strength of price movements;
• Potential trend reversal points.
Components of the MACD Indicator
The MACD indicator consists of three main components:
1. MACD Line
• The difference between the 12-period and 26-period exponential moving averages (EMA).
2. Signal Line
• A 9-period EMA calculated from the MACD line.
3. Histogram
• Represents the difference between the MACD line and the signal line, visualizing their convergence or divergence.
How Does MACD Work?
MACD is used to analyze trends and identify entry or exit points in trades.
Key MACD Signals:
1. MACD-Signal Line Crossovers:
• When the MACD line crosses the signal line from below, it’s a buy signal.
• When the MACD line crosses the signal line from above, it’s a sell signal.
2. Position Relative to the Zero Line:
• MACD above zero indicates a bullish trend.
• MACD below zero indicates a bearish trend.
3. Divergence:
• If the price moves in one direction and the MACD indicator moves in the opposite, it may signal a potential trend reversal.
Using MACD in Cryptocurrency Trading
The MACD indicator is particularly effective in highly volatile markets like cryptocurrencies.
Examples of Strategies with MACD:
1. MACD Line Crossovers:
• For example, when the MACD line crosses the signal line from below on the Bitcoin (BTC) chart, it may signal the beginning of a bullish trend.
2. Divergence:
• If the price of Ethereum (ETH) rises while the MACD indicator starts to decline, it may signal weakening momentum and a potential bearish reversal.
Advantages and Disadvantages of MACD
Advantages:
• Versatility: Works for trend analysis and identifying reversals.
• Flexibility: Effective across various timeframes and assets.
• Visualization: The histogram makes it easy to track trend strength changes.
Disadvantages:
• Lagging Signals: MACD relies on EMA, which may cause delayed signals.
• False Signals: In a sideways (range-bound) market, MACD can generate inaccurate signals.
Conclusion
MACD is a powerful tool for analyzing market trends and identifying trend reversals. However, to improve accuracy, it is recommended to use MACD alongside other technical analysis tools, such as RSI, ATR, or support and resistance levels.


