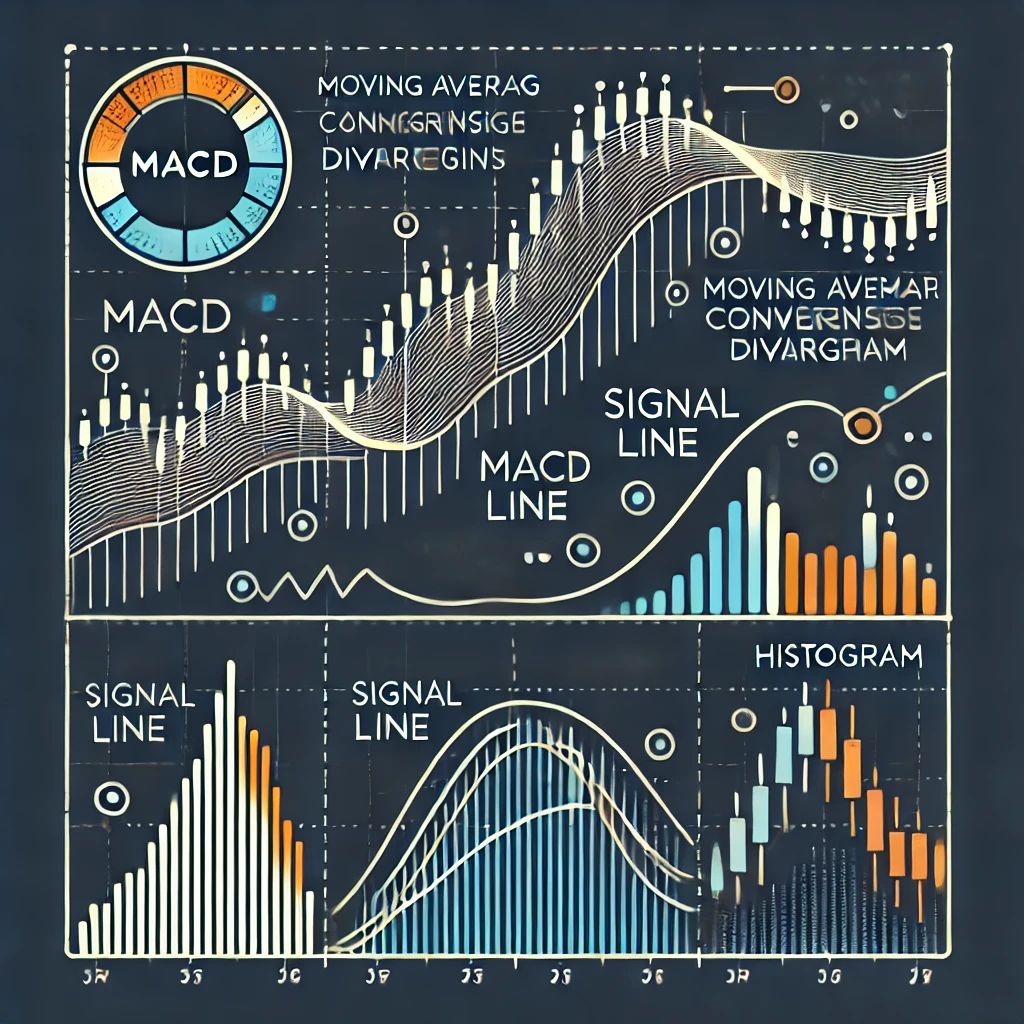
The Moving Average Convergence Divergence (MACD) is one of the most popular tools in technical analysis. It helps traders identify trend strength, direction, and potential reversal points. This guide will show you how to set up MACD and use it for effective trading.
What is MACD?
The MACD indicator consists of three main components:
1. MACD Line: The difference between the short-term and long-term exponential moving averages (usually EMA 12 and EMA 26).
2. Signal Line: An EMA (typically 9) of the MACD line that helps identify buy or sell signals.
3. Histogram: A graphical representation of the difference between the MACD line and the signal line.
How to Set Up the MACD Indicator
1. Choose a Trading Platform
The MACD indicator is available on almost all trading platforms, including TradingView, MetaTrader 4/5, Binance, and more.
2. Add MACD to Your Chart
1. Open the chart of the asset you want to analyze.
2. Locate the MACD indicator in the platform’s indicator library.
3. Add it to your chart.
3. Adjust the MACD Settings
• Short EMA (Fast EMA): Standard value is 12.
• Long EMA (Slow EMA): Standard value is 26.
• Signal Line: Standard value is 9.
These settings work well for most markets, but you can experiment with them to optimize signals for your trading style.
4. Select a Timeframe
MACD works on all timeframes, but its effectiveness depends on your trading style:
• Short Timeframes (M5, M15): For scalping and short-term trading.
• Medium and Long Timeframes (H1, D1): For medium-term and long-term trading.
How to Use MACD in Trading
1. Identifying Trends
• When the MACD line is above the zero line, the market is in an uptrend.
• When the MACD line is below the zero line, the market is in a downtrend.
2. Finding Entry and Exit Points
• Buy Signal: The MACD line crosses above the signal line.
• Sell Signal: The MACD line crosses below the signal line.
3. Using the Histogram
• Increasing histogram bars indicate strengthening trends.
• Decreasing histogram bars suggest weakening trends or potential reversals.
4. Combining with Other Indicators
To confirm MACD signals, you can use:
• RSI: To check for overbought or oversold conditions.
• Moving Averages: To confirm the trend direction.
Example Strategy Using MACD
Scenario:
You’re analyzing the ETH/USDT chart on the H1 timeframe.
1. The MACD line crosses above the signal line, and the histogram starts increasing.
2. This indicates the start of an uptrend.
3. You open a long position with a take-profit at the next resistance level.
4. Place a stop-loss below the nearest support level.
Tips for Using MACD
1. Use MACD in Trending Markets
It can generate false signals in sideways markets.
2. Don’t Rely Solely on MACD
Always confirm signals with other analysis methods.
3. Avoid Overtrading
Following every MACD signal without context can lead to losses.
Advantages and Disadvantages of MACD
Advantages:
• Simple to set up and use.
• Effective for identifying trend strength.
• Works on all markets and timeframes.
Disadvantages:
• May lag in highly volatile markets.
• Not suitable for flat markets without additional filters.
Conclusion
MACD is a versatile and reliable indicator suitable for both beginners and experienced traders. It helps identify trends, locate entry and exit points, and predict changes in market strength.
💡 Ready to try MACD in action? Set up the indicator on your platform and start analyzing the market today!


