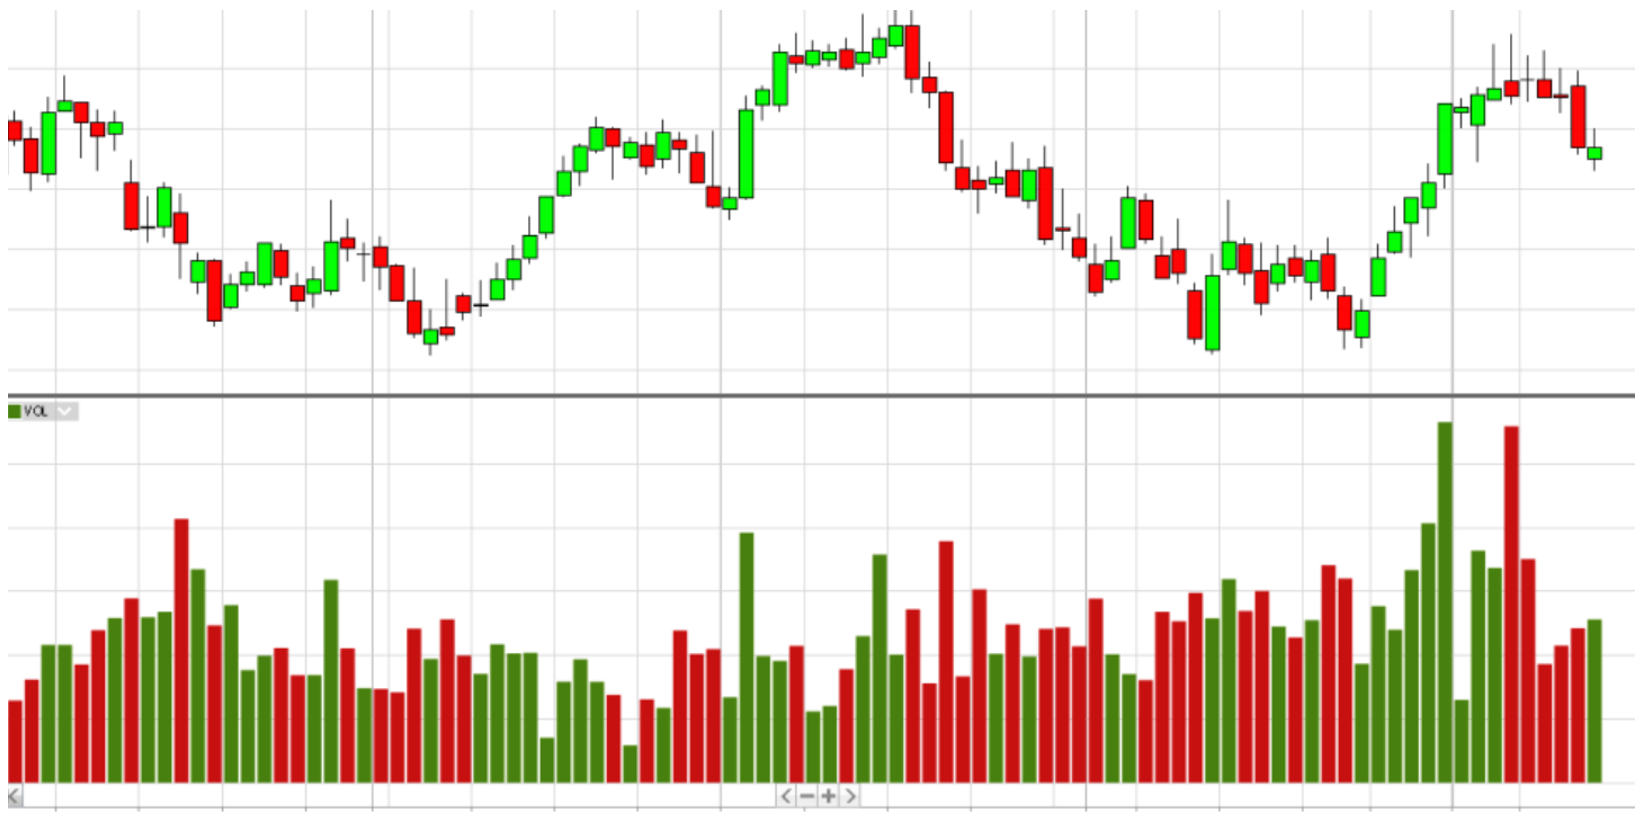
1. Candlestick Analysis:
• Study candlestick patterns.
• Begin with timeframes (1D and 12H) to determine the market’s current state: reversal or trend continuation.
Key candlestick patterns:
• Hammer
• Hanging Man
• Inverted Hammer
• Engulfing
• Shooting Star
• Doji
Note: Not all classic candlestick patterns are found in the cryptocurrency market due to traders’ preferences for the most popular combinations. Combine candlestick analysis with volume analysis for better accuracy.
2. Support and Resistance Levels:
• Levels are areas where the price may pause or reverse due to significant buyer and seller activity.
Three factors indicating level strength:
1. Duration: The more often the price bounces off a level, the stronger it is.
2. Range: A wide zone suggests level stability.
3. Volume: High trading volume signals the level’s importance for market participants.
Example: Bitcoin’s support at $6,000 in 2018, which held due to emotional trader attachment but eventually weakened due to market changes.
3. Trend Lines:
• Trend lines help identify market direction (upward or downward).
Common patterns in cryptocurrency markets:
• Triangles
• Wedges
• Pennants
• Flags
• Double Top/Bottom
• Head and Shoulders
Larger and smaller patterns often appear simultaneously, providing insights into price dynamics on different scales.
4. Indicators and Volume:
• Technical analysis relies on indicators. Popular ones include:
• Moving Average (MA)
• Relative Strength Index (RSI)
• Stochastic Oscillator
• MACD
• Awesome Oscillator (AO)
Tip: Volume analysis is crucial. For instance, a sharp price increase without volume confirmation may indicate weakness in the movement.
Fibonacci Numbers in Trading:
• Fibonacci levels help identify retracements and key price points.
Key Fibonacci levels:
• 23.6%, 38.2%, 50%, 61.8%, 78.6%, 100%
Application: Use these levels on higher timeframes (3 to 6 hours). For example, during the 2018 bear market, corrections often ended near the 61.8% level.
Recommendations for beginners:
• Analyze the market on timeframes from 1 to 4 hours.
• Avoid short timeframes to reduce emotional decision-making.
• Trade pairs with USD to simplify analysis and avoid variables linked to BTC price.
Remember: No analysis guarantees 100% accuracy. Technical analysis is a tool for estimating price movement probabilities, not predicting outcomes.
Conclusion:
Knowledge of candlestick patterns, levels, trend lines, indicators, and Fibonacci numbers forms the foundation of successful trading. Combine different methods and always use volume confirmation to make well-informed market decisions.


