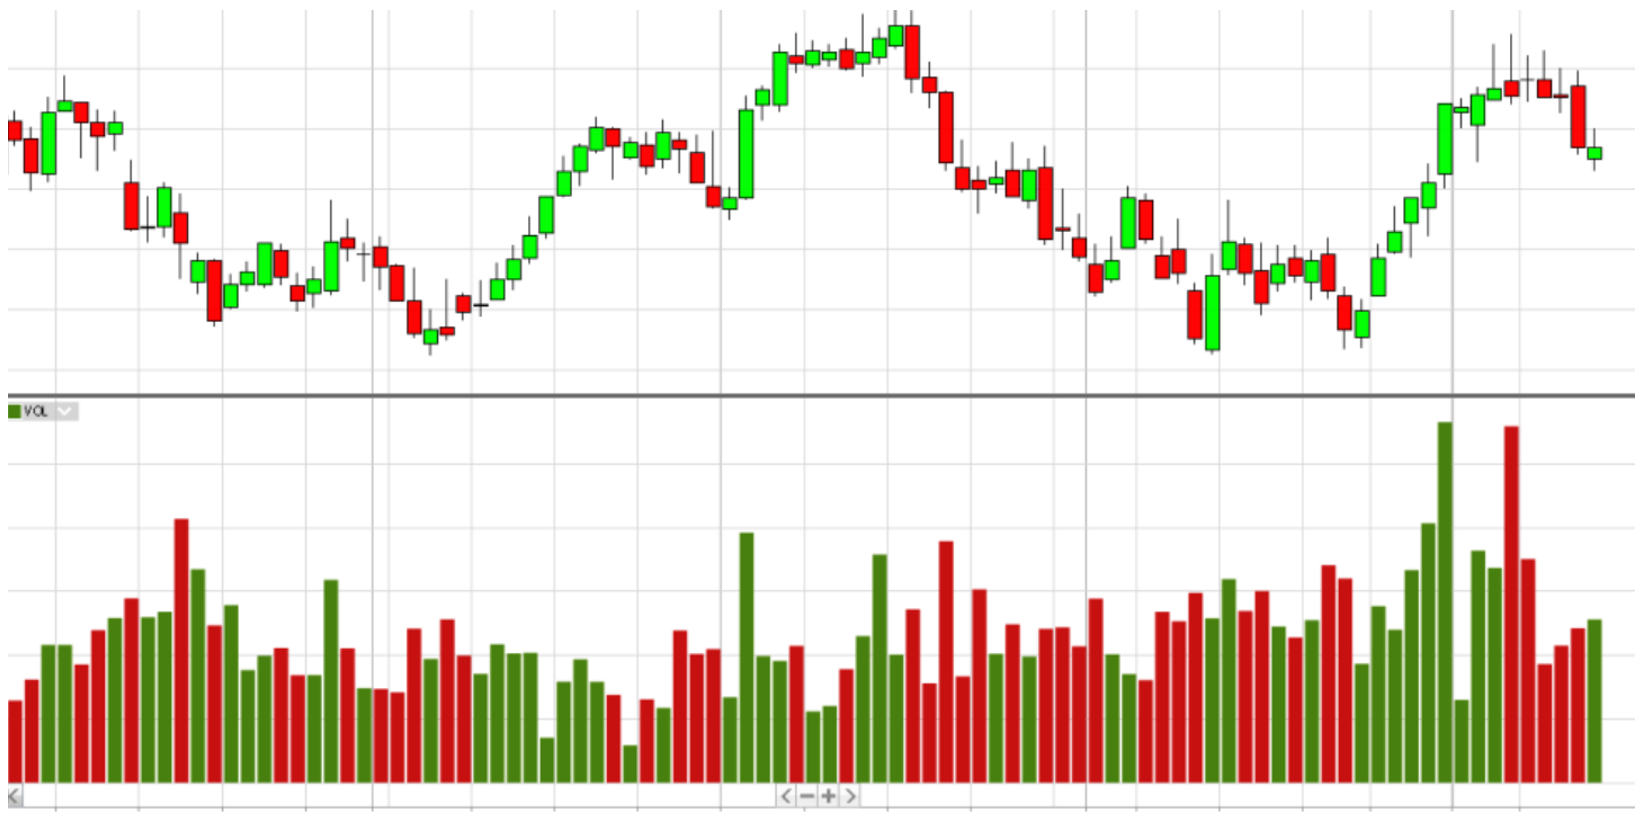
📌 In this article, we’ll cover:
✅ What entry and exit points are in trading.
✅ Key chart analysis methods: support/resistance, trends, candlestick patterns.
✅ How to find the best trade entries and exits to maximize profits.
🔥 Finding accurate entry and exit points is the key to profitable trading. Want to learn how? Keep reading!
1. What Are Entry and Exit Points?
💡 Entry point – the moment when a trader opens a position (buys or sells an asset).
💡 Exit point – the moment when a trader closes a trade, securing a profit or loss.
📊 Why is it important to find the right entries and exits?
✔️ Entering too early – increases the risk of being stopped out.
✔️ Exiting too late – results in lost profits.
✔️ Having a clear exit strategy – protects your capital from unnecessary losses.
📢 Conclusion: A good trader not only knows where to enter a trade but also plans their exit in advance!
2. Key Tools for Finding Entry and Exit Points
📌 1. Support and Resistance Levels
📊 Support – a level where price often bounces upward.
📊 Resistance – a level where price often reverses downward.
✅ How to use them?
🔹 Buy near support when the price bounces.
🔹 Sell near resistance when the price struggles to break through.
🔹 If a level breaks, it signals a possible trend continuation.
📌 2. Trend Lines
📊 Uptrend – a series of higher highs and higher lows.
📊 Downtrend – a series of lower highs and lower lows.
✅ How to use them?
🔹 Buy on pullbacks in an uptrend.
🔹 Sell on pullbacks in a downtrend.
🔹 If a trend line is broken, it may indicate a trend reversal.
📌 3. Candlestick Patterns
📊 Reversal Patterns:
🔹 Hammer – signals a potential bullish reversal.
🔹 Engulfing pattern – confirms trend change.
📊 Continuation Patterns:
🔹 Flag – indicates trend continuation after a pullback.
🔹 Triangle – signals a possible breakout.
✅ How to use them?
🔹 Enter trades when a candlestick pattern aligns with support/resistance or trend confirmation.
3. Where to Find the Best Entry Points?
✅ 1. Wait for pullbacks before entering a trade in a trend.
✅ 2. Buy near support levels, sell near resistance.
✅ 3. Look for confirmation signals (candlestick patterns, indicators).
✅ 4. Avoid entering trades during extreme market volatility.
📢 Conclusion: The best entries are not where “the market moves,” but where there is logical confirmation!
4. How to Exit a Trade Properly?
✅ 1. Use Take Profit (TP) Levels
🔹 Exit trades near key support/resistance levels.
✅ 2. Set a Stop-Loss (SL)
🔹 Protect your capital by placing a stop-loss below support or above resistance.
✅ 3. Scale Out of Positions
🔹 Close part of your position at the first profit target and let the rest run with the trend.
📢 Conclusion: A well-planned exit strategy is just as important as a precise entry!
5. Summary: How to Find the Best Entry and Exit Points?
✅ Use support and resistance levels to identify key price zones.
✅ Follow trend analysis and candlestick patterns for confirmation.
✅ Wait for strong entry signals instead of chasing price movements.
✅ Use take profits and stop-losses to manage exits effectively.
💬 Which entry and exit strategy works best for you? Share in the comments!
📢 Want to improve your trade execution? Master chart analysis – and your trades will become more profitable! 🚀


