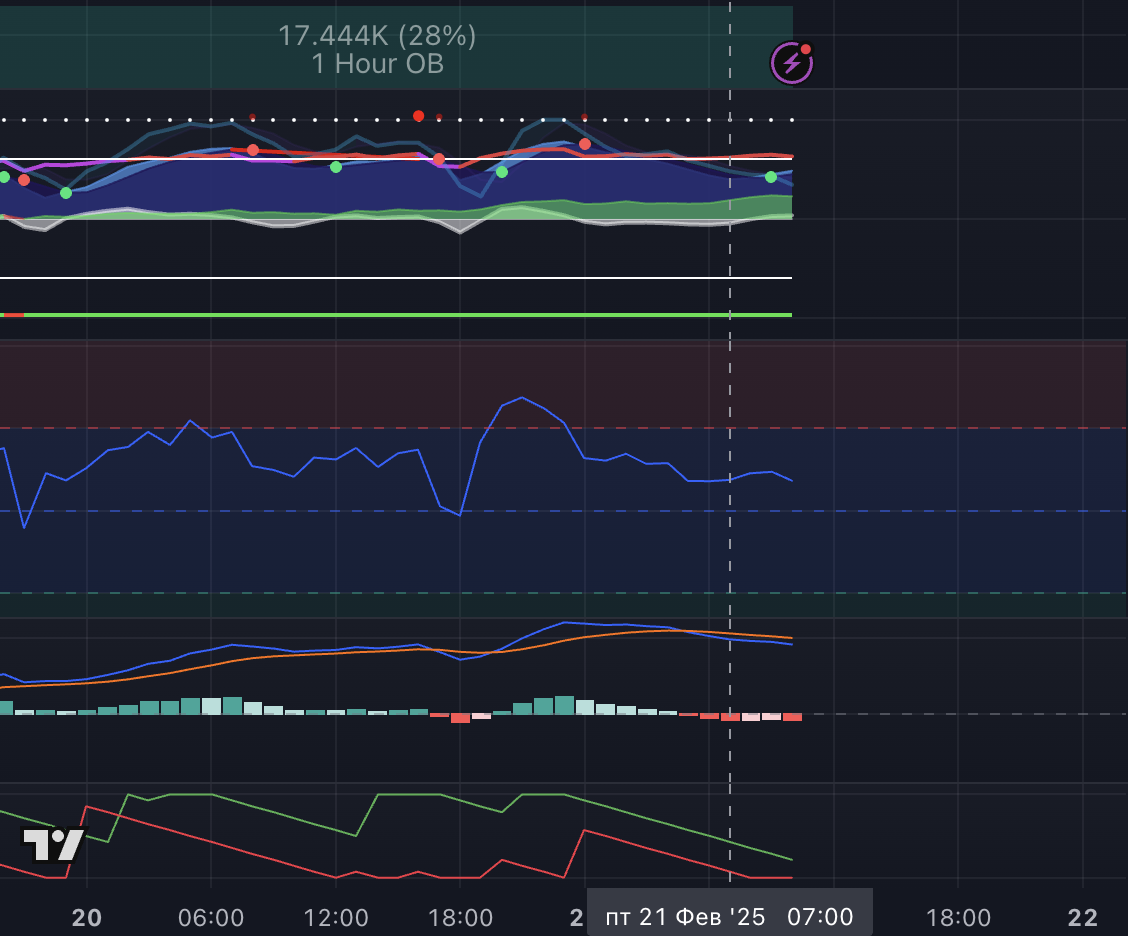
Indicators are an essential tool for market analysis and making informed decisions. In this article, we will cover the top 5 indicators that can help you trade successfully and minimize risks. Each indicator will be explained in simple terms, so even beginner traders can easily understand their purpose.
1. Moving Average (MA)
What is it:
The Moving Average is one of the most popular indicators, showing the average price of an asset over a specific period.
How to use:
• Use the crossover of short-term and long-term moving averages to determine the trend.
• If the short-term MA crosses above the long-term MA, it’s a buy signal. The opposite indicates a sell signal.
Advantages:
• Simple to use.
• Suitable for analyzing both short-term and long-term trends.
2. Relative Strength Index (RSI)
What is it:
The RSI measures the strength of the current trend and helps identify overbought and oversold zones.
How to use:
• Values above 70 indicate overbought conditions (sell signal).
• Values below 30 indicate oversold conditions (buy signal).
Advantages:
• Excellent for identifying entry and exit points.
• Works on all timeframes.
3. Bollinger Bands
What is it:
This indicator consists of three lines: a moving average and two lines showing the standard deviation of the price.
How to use:
• When the price touches the upper band, it could be a sell signal.
• When the price touches the lower band, it could be a buy signal.
Advantages:
• Helps determine market volatility.
• Works well in sideways markets.
4. Volume Indicator
What is it:
The Volume Indicator shows the number of assets bought or sold over a specific period.
How to use:
• Increasing volume during price movement confirms the trend.
• Decreasing volume might signal a potential reversal.
Advantages:
• Helps assess the strength of the trend.
• Complements other indicators effectively.
5. Stochastic Oscillator
What is it:
The Stochastic Oscillator helps determine if the price of an asset is in an overbought or oversold condition.
How to use:
• Values above 80 indicate overbought conditions (sell signal).
• Values below 20 indicate oversold conditions (buy signal).
Advantages:
• Quickly responds to market changes.
• Suitable for intraday trading.
How to Choose the Right Indicator?
1. Define your trading style:
For instance, Moving Averages are better for long-term analysis, while RSI and Stochastic are ideal for short-term trading.
2. Don’t overload your chart:
Use no more than 2-3 indicators at a time to avoid confusion.
3. Test the indicators:
Try each indicator on a demo account to understand how it works.
Conclusion
Indicators are a powerful tool, but remember that none of them guarantee 100% success. Use them in combination with proper risk management and your own market analysis.
💡 If you want to learn more about indicators or how to set them up, feel free to leave your questions in the comments!


