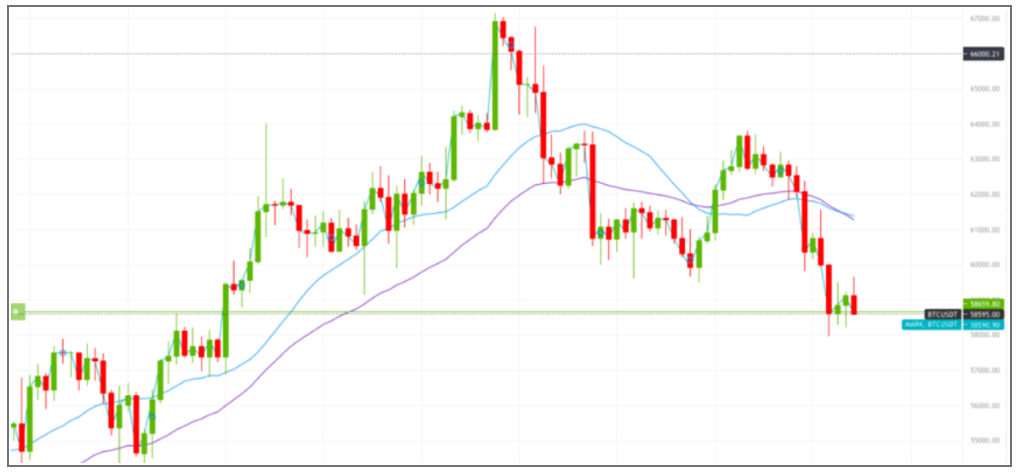
The Simple Moving Average (SMA) is one of the most fundamental tools in technical analysis. Widely used in both cryptocurrency and traditional markets, the SMA helps traders smooth out price fluctuations and identify primary market trends, making it especially valuable in highly volatile environments.
What is SMA?
The SMA is the average price of an asset over a specific period. It helps traders understand the overall market sentiment by eliminating short-term price noise.
How is SMA calculated?
The formula is simple: the sum of all prices over the selected period is divided by the number of periods. For example:
• 10-day SMA: The average price over the past 10 days.
• 50-day SMA: A long-term indicator for analyzing trends.
How Does SMA Work?
The SMA is used to analyze current market conditions:
• If the price is above the SMA, it indicates a potential uptrend.
• If the price is below the SMA, it signals a downtrend.
Key SMA Signals:
1. Uptrend: The price stays above the SMA. This is a signal to open a long position.
2. Downtrend: The price remains below the SMA. This is a signal to sell or open a short position.
Using SMA in Cryptocurrency Trading
The SMA can be used as a standalone indicator or combined with other tools. It is effective for analyzing trends across all assets and timeframes.
Buy and Sell Signals:
1. Buy:
If the price crosses the SMA from below, it signals the start of an uptrend.
• Example: Bitcoin (BTC) crossing the 50-day SMA from below may indicate a strong bullish trend.
2. Sell:
If the price crosses the SMA from above, it indicates a downtrend.
• Example: Ethereum (ETH) dropping below the 200-day SMA signals a bearish continuation.
Advantages and Disadvantages of SMA
Advantages:
1. Simplicity: Easy to calculate and use, even for beginners.
2. Versatility: Works on any market and with any asset.
3. Effectiveness in Trending Markets: Clearly shows price direction in strong trends.
Disadvantages:
1. Lagging Indicator: SMA reacts to price changes with a delay, which can result in late signals.
2. False Signals in Sideways Markets: In flat or ranging markets, SMA may produce misleading signals.
Combining SMA with Other Indicators
To enhance signal accuracy, SMA is best used alongside other technical analysis tools:
1. RSI (Relative Strength Index):
• Identifies whether an asset is overbought or oversold.
• Example: If the price is above the SMA and RSI confirms an uptrend, it’s a strong buy signal.
2. MACD:
• Shows the convergence or divergence of moving averages.
• Example: If MACD crosses the signal line upwards while the price is above the SMA, it confirms an uptrend.
3. Bollinger Bands:
• Helps measure volatility.
• Example: If the price is above the middle Bollinger Band and the SMA, it indicates a strong bullish market.
Choosing Timeframes for SMA
The choice of timeframe depends on your trading strategy:
• Short Timeframes (5–15 minutes): Ideal for scalping.
• Medium Timeframes (1–4 hours): Suitable for swing trading.
• Long Timeframes (1 day and above): Best for position trading.
Examples of SMA in Action
1. Bullish Market:
• If an asset’s price consistently remains above the 50-day and 200-day SMA, it signals a strong uptrend.
2. Bearish Market:
• When the price drops below the 200-day SMA, it indicates a potential long-term downtrend.
3. Crossovers:
• Golden Cross: When the 50-day SMA crosses above the 200-day SMA, it’s a strong buy signal.
• Death Cross: When the 50-day SMA crosses below the 200-day SMA, it signals a sell-off.
Conclusion
The SMA is a versatile and beginner-friendly tool for analyzing trends. However, its effectiveness increases when combined with other indicators like RSI, MACD, and Bollinger Bands.
In the next articles, we will explore Bollinger Bands to assess volatility and EMA (Exponential Moving Average) — an indicator that offers faster signals than SMA.
Don’t miss our upcoming materials to expand your knowledge and improve your trading skills!


