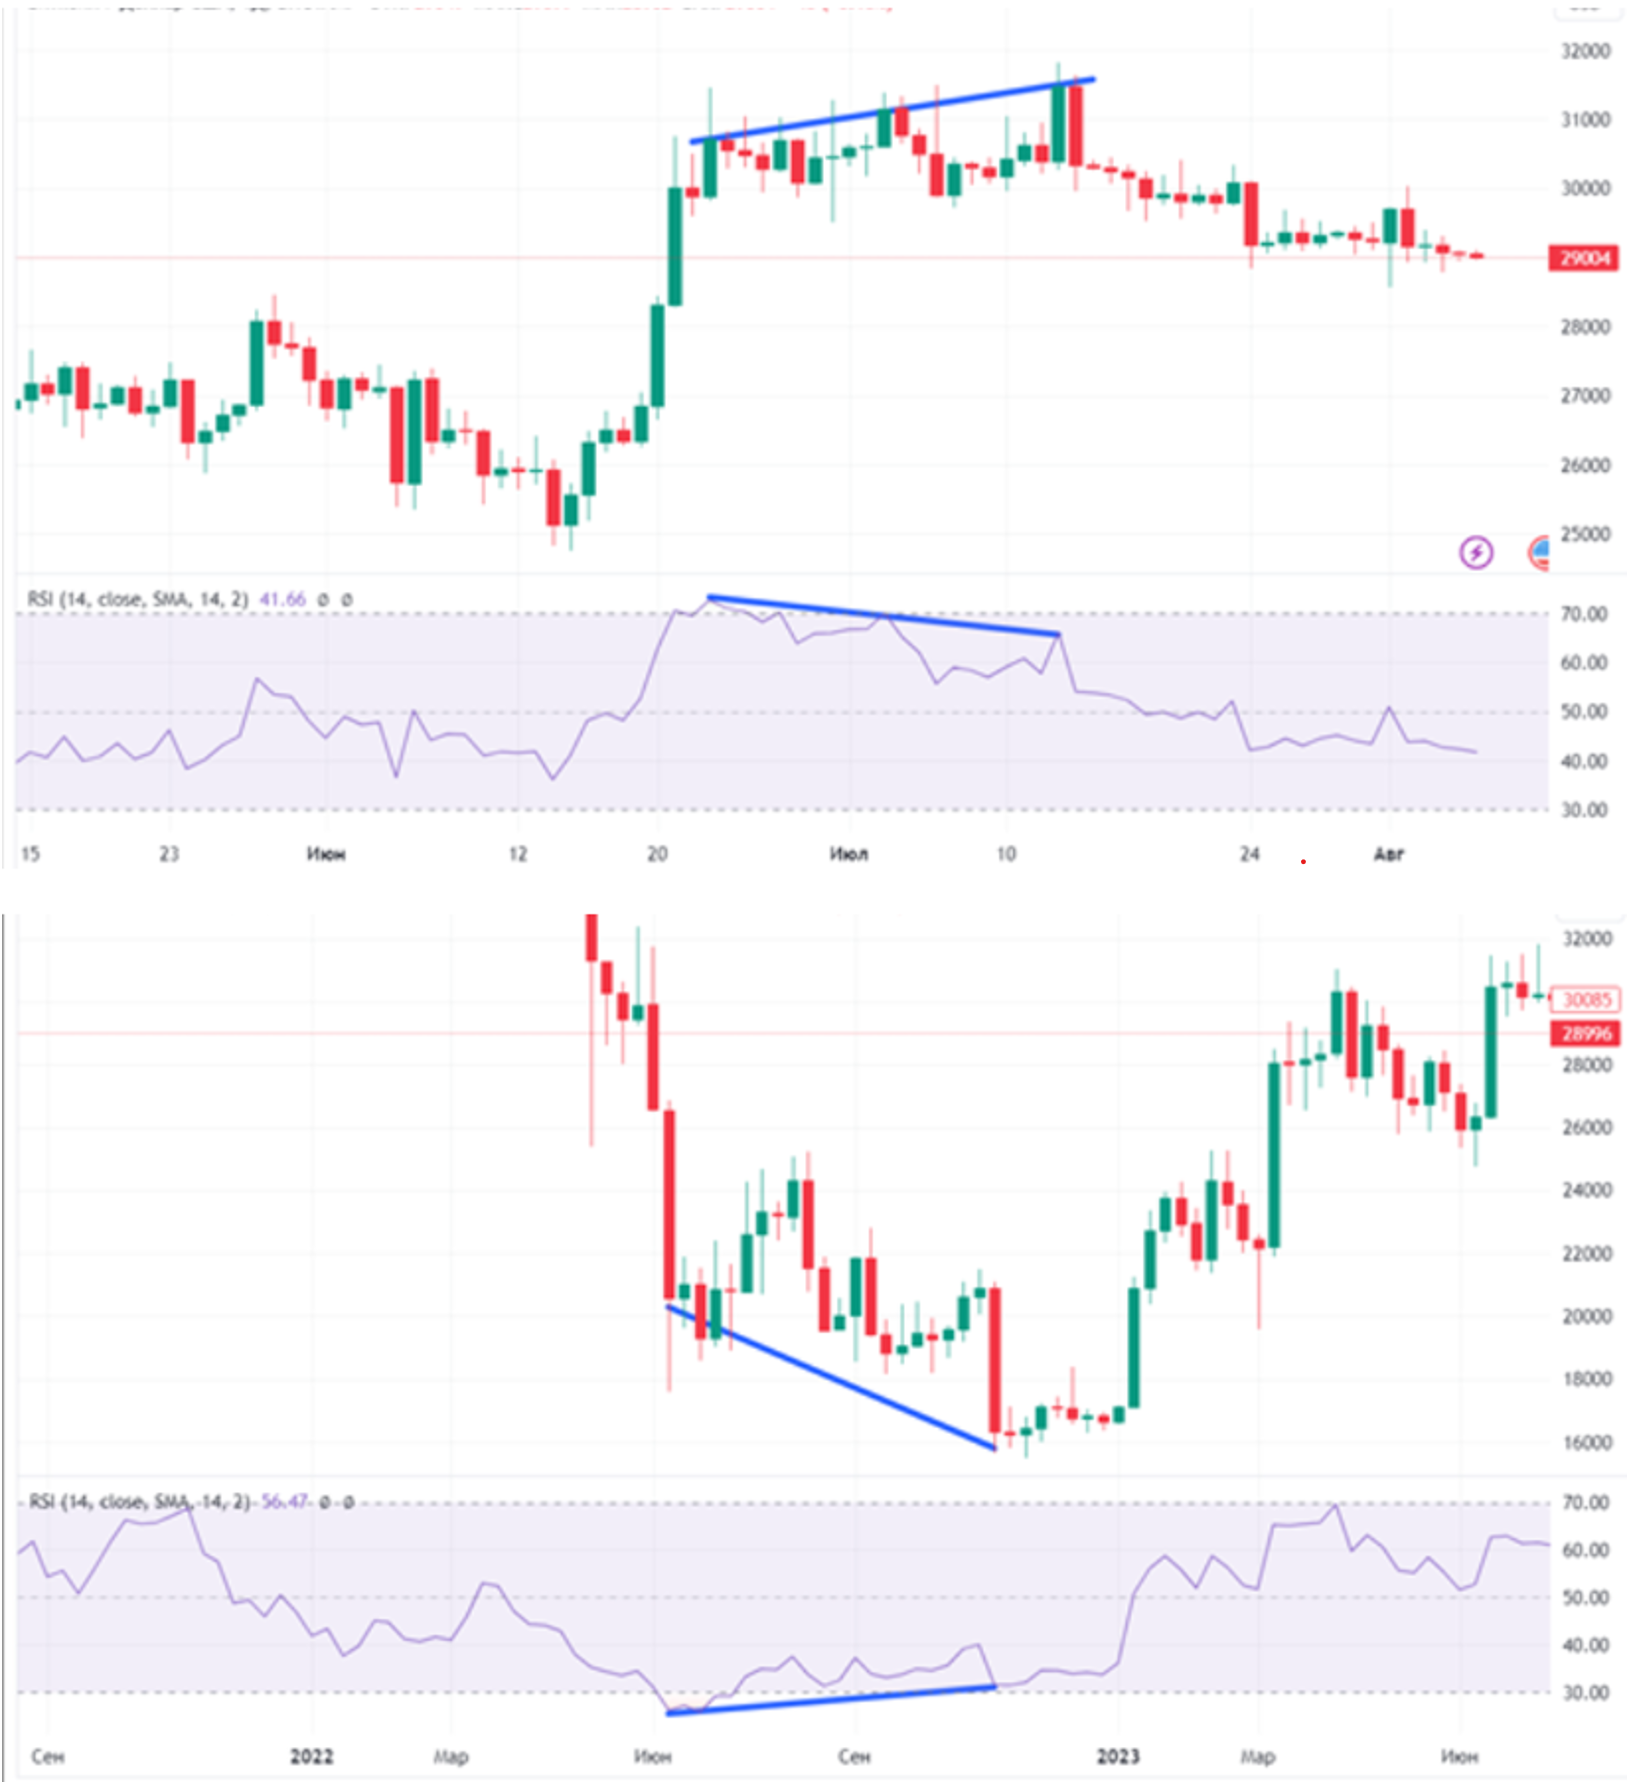
The Relative Strength Index (RSI) is a popular momentum oscillator widely used by traders to analyze market trends and identify overbought or oversold conditions. This technical indicator aids in making informed decisions across various markets, including cryptocurrencies.
How Does RSI Work?
RSI measures the speed and magnitude of price changes on a scale from 0 to 100:
• RSI above 70 signals an overbought zone, suggesting potential trend weakening or a downward correction.
• RSI below 30 indicates an oversold zone, hinting at a possible reversal to the upside.
Key RSI Signals:
1. Overbought: RSI > 70 implies the asset might be overvalued, possibly leading to a price drop or correction.
2. Oversold: RSI < 30 indicates undervaluation, suggesting the price may rebound upward.
3. Divergence: When price moves in one direction and RSI moves in the opposite, it often signals an upcoming trend reversal.
Using RSI in Cryptocurrency Trading
In the highly volatile cryptocurrency market, RSI helps identify entry and exit points. For better accuracy, it is recommended to combine RSI with other tools like Bollinger Bands.
Example RSI Strategies:
• Buying in the Oversold Zone:
When RSI drops below 30, and the price touches the lower Bollinger Band, it can be a strong buy signal.
Example: RSI for Ethereum (ETH) < 30, and the price nears the lower Bollinger Band — a potential upward reversal is likely.
• Selling in the Overbought Zone:
If RSI exceeds 70 and the price approaches the upper Bollinger Band, it may indicate a good time to sell.
Example: RSI for Bitcoin (BTC) > 70, and the price is near the upper Bollinger Band — a downward correction may occur.
Pros and Cons of RSI
Advantages:
• Ease of Use: RSI is straightforward and suitable for traders of all experience levels.
• Identifying Extreme Zones: It effectively highlights overbought and oversold conditions.
• Divergence Detection: Helps anticipate potential trend reversals.
Disadvantages:
• False Signals: In strong trends, RSI can remain in overbought or oversold zones for an extended period without reversal.
• Period Sensitivity: The standard 14-period setting may not be optimal for all market conditions, requiring adjustments.
Conclusion
The Relative Strength Index (RSI) is a reliable tool for analyzing market momentum and identifying key entry and exit points. However, for improved accuracy, it’s best to use RSI alongside other technical indicators.
In our next article, we will explore MACD (Moving Average Convergence Divergence) — a powerful indicator for identifying trends and assessing their strength.
If you haven’t yet learned about Bollinger Bands, check out our article to understand how they can help analyze market volatility and identify potential price reversals.


