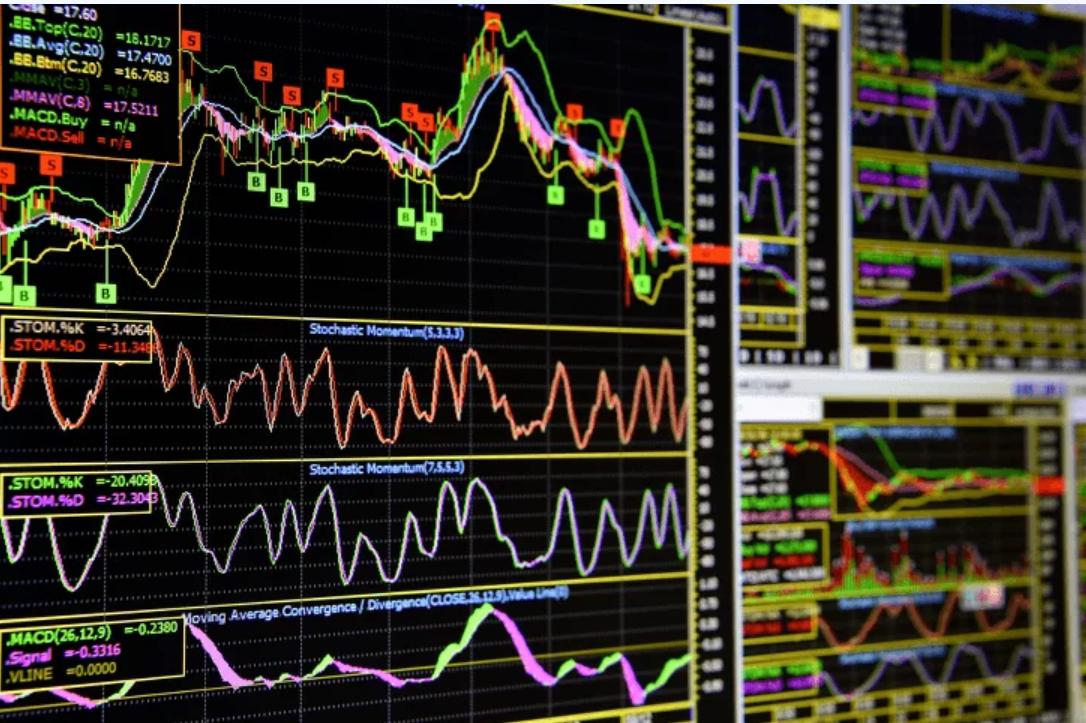
Technical indicators are essential tools in the arsenal of any cryptocurrency trader. These tools help analyze market behavior, predict price movements, and make informed trading decisions.
What are Technical Indicators?
Technical indicators are mathematical formulas that analyze price and trading volume. They provide traders with valuable insights into market trends, overbought or oversold conditions, and potential entry or exit points.
In the cryptocurrency market, technical indicators are particularly important due to its high volatility. Without reliable analytical tools, traders risk being misled by market noise.
Why Do Traders Need Technical Indicators?
The cryptocurrency market is unpredictable and dynamic. Technical indicators help traders:
• Understand the current market situation.
• Avoid emotional decisions.
• Identify entry and exit points with minimal risks.
• Filter out market noise.
Main Types of Technical Indicators
All indicators can be divided into four main categories, each providing unique insights:
1. Trend Indicators
These indicators help identify the market’s overall direction.
• Examples:
• SMA (Simple Moving Average): Shows the average price over a specific period.
• Bollinger Bands: Identify overbought and oversold levels.
2. Momentum Indicators
These tools measure the speed of price movement and indicate trend strength.
• Examples:
• RSI (Relative Strength Index): Helps identify whether an asset is overbought or oversold.
• MACD: Shows the convergence or divergence of moving averages.
3. Volatility Indicators
Volatility indicators measure the degree of price fluctuation.
• Examples:
• ATR (Average True Range): Measures the range of price movement.
• Bollinger Bands: Assess price volatility.
4. Volume Indicators
These indicators analyze trading activity to understand market strength.
• Examples:
• OBV (On-Balance Volume): Tracks the trend direction based on volume.
• VWAP: Calculates the average price of an asset weighted by volume.
Key Concepts in Technical Analysis
To use indicators effectively, it’s essential to understand fundamental market concepts:
1. Trend: The direction of price movement (uptrend, downtrend, or sideways).
2. Support and Resistance Levels: Zones where the price often slows or reverses.
3. Overbought and Oversold Conditions: Indicate when the price reaches extreme levels.
4. Divergence and Convergence: Differences between price movement and indicators that signal trend weakening or confirmation.
How to Use Technical Indicators in Cryptocurrency Trading
Indicators can be used individually, but combining them provides more accurate signals. Here are some examples:
• Example 1: An uptrend confirmed by MACD and high trading volume signals a good buying opportunity.
• Example 2: If RSI indicates overbought conditions and the price approaches resistance, it may be a signal to take profits.
Advanced Use of Indicators
1. Combining Trend and Momentum Indicators:
Use SMA to identify the trend and RSI to find entry points.
2. Volume Analysis:
When price rises without increased volume, the movement may lack sustainability, signaling a potential reversal.
3. Indicators in Volatile Markets:
During high market fluctuations, Bollinger Bands help identify when prices approach extreme levels.
Conclusion
Technical indicators are powerful tools for traders looking to succeed in the volatile cryptocurrency market. They simplify analysis and help make informed decisions.
In upcoming articles, we will explore popular indicators such as SMA, Bollinger Bands, RSI, MACD, and ATR in greater detail. Subscribe to stay updated and continue learning!


