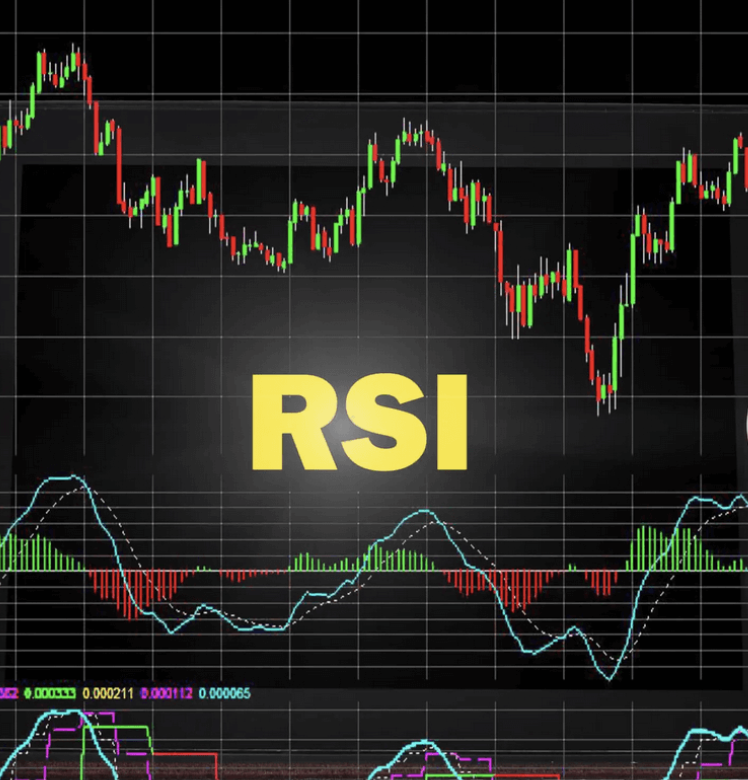
What is the RSI Indicator and How Does It Work?
The Relative Strength Index (RSI) is an oscillator that measures the speed and change of price movements. It ranges from 0 to 100 and helps identify overbought and oversold levels, making it a powerful tool for analyzing market trends.
RSI in Trading
RSI is widely used in both stock trading and cryptocurrency trading. The main idea behind it is that an asset with an RSI value above 70 is considered overbought, while an asset with an RSI below 30 is considered oversold. This helps traders make informed decisions when entering and exiting positions.
Why is the RSI Indicator Important for Intraday Trading?
RSI is especially useful in short-term strategies like scalping and intraday trading because it helps identify moments of overbought and oversold conditions.
How to Use RSI for Intraday Trading
1. *RSI on the Chart* – Helps visually determine key levels.
2. *RSI Signals* – Can serve as confirmation for opening or closing a position.
3. *Using RSI in Trading* – Helps identify trend corrections and assess trend strength.
💡 Tip: Traders can combine RSI with other indicators like MACD and moving averages to improve prediction accuracy.
Setting Up the RSI Indicator for Maximum Efficiency
For effective use of the RSI indicator, it is important to configure it correctly. Optimal parameters may vary depending on the trading style and time frame.
How to Set Up the RSI Indicator
1. *Choosing the Calculation Period* – The standard RSI value is 14, but for short-term strategies, a value of 7 can be used.
2. *Adding Levels* – Recommended levels: 30 (oversold) and 70 (overbought).
3. *Combining RSI with Other Indicators* – Technical analysis suggests that combining RSI with Bollinger Bands can provide more accurate signals.
RSI in Crypto Trading: How to Apply It in the Cryptocurrency Market
The cryptocurrency market is highly volatile, so using RSI can help traders make more informed decisions.
RSI Chart in Crypto Trading
• *Using RSI in Crypto Trading* – Helps analyze short-term price changes.
• *Trend Prediction* – RSI indicates when an asset moves into overbought or oversold conditions.
• *RSI in Technical Analysis for Cryptocurrencies* – A crucial tool for both intraday traders and long-term investors.
💡 Tip: Monitor chart changes and use RSI in combination with other indicators to minimize risks.
Conclusion: Why You Should Use RSI in Trading
RSI is a powerful tool that helps traders forecast market movements, determine overbought and oversold conditions, and identify entry and exit points.
📌 *Key Benefits of RSI:*
✔ Evaluates trend strength.
✔ Helps identify overbought and oversold zones.
✔ Works in combination with other indicators like MACD and moving averages.
💡 Final Thought: Use RSI alongside other technical analysis tools to improve your trading efficiency!


