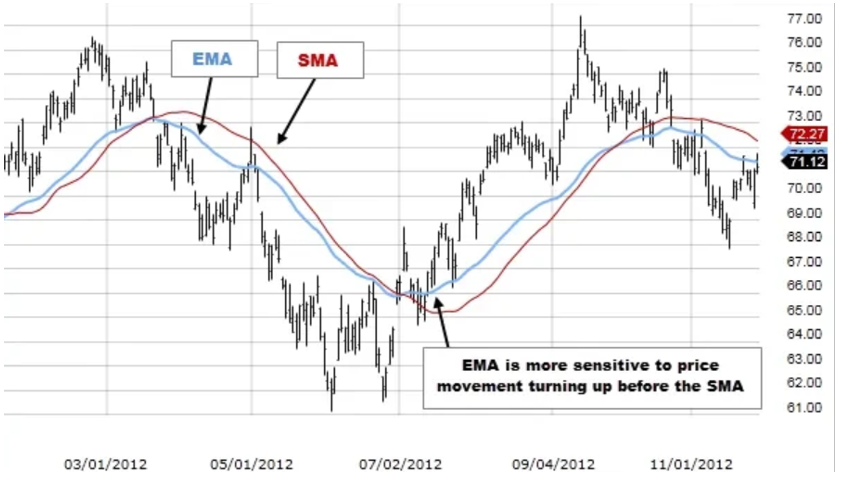
The Exponential Moving Average (EMA) is one of the key indicators in technical analysis, widely used by traders to react quickly to price changes. Due to its sensitivity to recent price movements, the EMA is an essential tool for analyzing highly volatile markets like cryptocurrencies.
What is EMA?
The EMA is a type of moving average that gives more weight to recent price data, making it more responsive compared to the Simple Moving Average (SMA).
The main purpose of EMA is to help traders identify trends, find entry and exit points, and determine dynamic support and resistance levels.
How is EMA Calculated?
The EMA calculation begins with the SMA over a specific period. A smoothing factor is then applied, giving more significance to recent price data. This formula balances historical data with current prices, making the EMA suitable for both short-term and long-term trend analysis.
Advantages and Disadvantages of EMA
Advantages of EMA:
1. Quick Response: EMA reacts faster to price changes, making it ideal for analyzing short-term trends.
2. Flexibility: It works effectively across various timeframes and asset types, including cryptocurrencies.
3. Efficiency in Volatile Markets: EMA excels in highly volatile conditions by providing accurate signals.
Disadvantages of EMA:
1. More False Signals: Due to its sensitivity, EMA may produce false signals during market noise.
2. Less Stability: EMA is more affected by sharp price swings, requiring confirmation from additional tools.
Using EMA in Cryptocurrency Trading
EMA is widely used for trend identification, reversals, and as a dynamic support or resistance level.
Example Strategies:
1. EMA Crossover Strategy:
Traders often use two EMAs (e.g., 12-period and 26-period) to generate signals.
• Buy Signal: When the shorter EMA crosses the longer EMA from below.
• Sell Signal: When the shorter EMA crosses the longer EMA from above.
• Example: If the 12-day EMA crosses the 26-day EMA on Bitcoin (BTC) from below, it may indicate the start of an uptrend.
2. EMA as Support or Resistance:
• EMA can act as a dynamic level where the price bounces during a trend.
• Example: If Ethereum (ETH) bounces off the 50-day EMA during an uptrend, it could be a signal to buy.
Combining EMA with Other Indicators
1. EMA and MACD:
• EMA is a core component of MACD, which measures the convergence or divergence of two EMAs.
• Example: If MACD confirms an EMA signal, it strengthens the likelihood of a successful trade.
2. EMA and RSI:
• Combining EMA with RSI helps identify entry and exit points based on overbought or oversold conditions.
• Example: If RSI indicates overbought conditions and the price drops below EMA, it may signal a sell.
Choosing Timeframes for EMA
The choice of timeframe depends on your trading style:
• Short Timeframes (5–15 minutes): Ideal for scalping.
• Medium Timeframes (1–4 hours): Suitable for swing trading.
• Long Timeframes (1 day and above): Best for analyzing global trends.
Conclusion
The Exponential Moving Average (EMA) is a powerful tool for traders looking to react quickly to price changes and adapt to market conditions. However, like any indicator, EMA is most effective when combined with other tools, such as MACD or RSI.
If you missed our article on the Simple Moving Average (SMA), we recommend reading it to better understand how to analyze trends. In the next article, we will explore Bollinger Bands, a popular indicator for analyzing volatility and identifying key entry and exit points.


