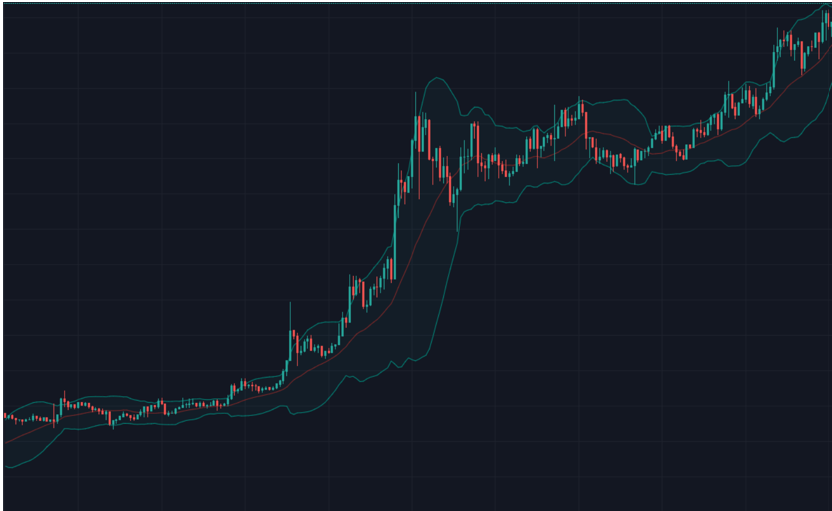
What Are Bollinger Bands?
Bollinger Bands are a popular technical indicator used to measure market volatility and identify potential price reversal points. The indicator consists of three key components:
1. Middle Line (SMA): A simple moving average (usually 20 periods) that serves as the basis for the calculations.
2. Upper Band: Positioned two standard deviations above the middle line.
3. Lower Band: Positioned two standard deviations below the middle line.
This tool helps traders visualize price movement in relation to market volatility and assess the current trading environment.
How Do Bollinger Bands Work?
The primary purpose of Bollinger Bands is to indicate the level of market volatility.
• High Volatility: Bands expand.
• Low Volatility: Bands contract.
Key Signals:
1. Breakout Above the Upper Band: This may indicate overbought conditions and a potential price reversal downward.
2. Breakout Below the Lower Band: This may signal oversold conditions and a potential upward reversal.
3. Band Squeeze: Indicates reduced volatility and a likelihood of sharp price movements in the near future.
Using Bollinger Bands in Cryptocurrency Trading
Trend-Following Strategies:
1️⃣ Sell on Breakout Above the Upper Band:
• When the price significantly moves above the upper band, it may be a signal to take profit.
• Example: If Bitcoin (BTC) breaks above the upper band and RSI indicates overbought conditions, this could signal a sell opportunity.
2️⃣ Buy on Breakout Below the Lower Band:
• When the price drops below the lower band and there are signs of oversold conditions, it could signal a buy opportunity.
• Example: Ethereum (ETH) falls below the lower band, and RSI confirms oversold conditions, making it a potential buy signal.
Counter-Trend Strategies:
1️⃣ Trading Reversals:
• Bollinger Bands are often used to identify reversal points when the price approaches one of the bands.
• Example: If Ripple (XRP) touches the lower band and starts reversing upward, it may signal a long position.
Advantages and Disadvantages of Bollinger Bands
Advantages:
✅ Flexibility: Suitable for various timeframes and assets, including cryptocurrencies.
✅ Versatility: Effective in both trending and range-bound markets.
✅ Visual Representation of Volatility: Clear depiction of market activity changes.
Disadvantages:
❌ Lagging Indicator: Bollinger Bands are based on moving averages, which can cause delayed signals.
❌ False Signals: In sideways markets, Bollinger Bands may generate frequent and inaccurate signals.
How to Improve the Use of Bollinger Bands?
1. Combine with Other Indicators: Use RSI, MACD, or volume analysis to confirm signals.
2. Backtest Strategies: Test Bollinger Band signals on historical data before applying them to live trading.
3. Adapt to Timeframes: Bollinger Bands work across all intervals, but their effectiveness depends on your trading style.
Conclusion
Bollinger Bands are a powerful tool for assessing volatility and identifying potential price reversal points. For maximum efficiency, they should be used in combination with other indicators, such as RSI.
💡 Test your strategies using Bollinger Bands on cryptonna.com and discover new opportunities for successful trading!
#Cryptonna


