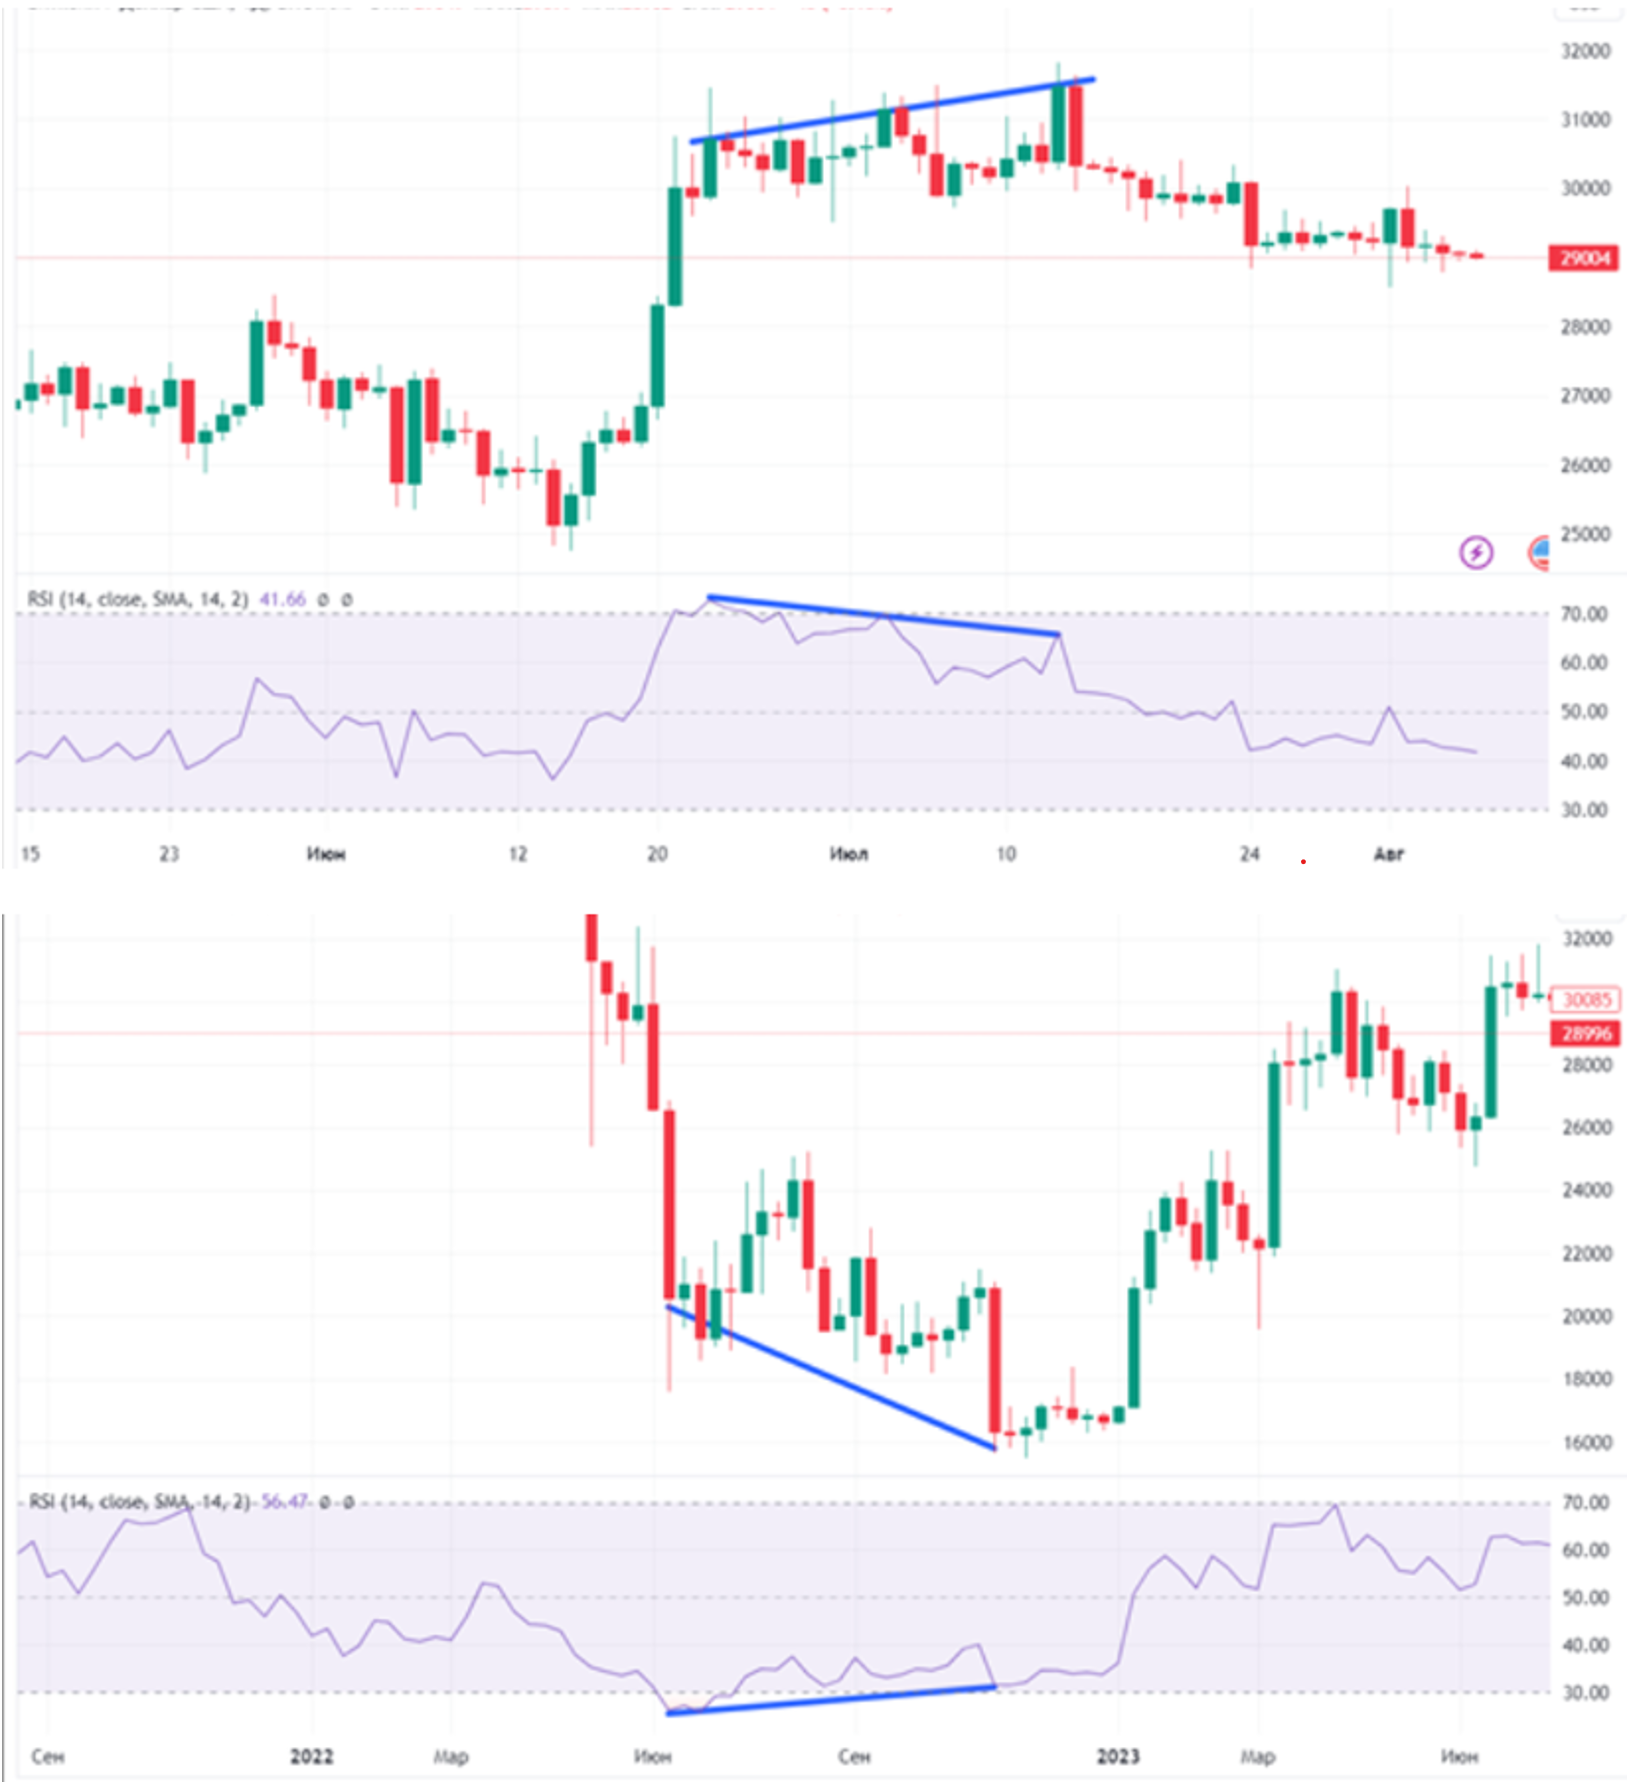
What is RSI? The Relative Strength Index (RSI) is a popular momentum oscillator that measures the speed and change of price movements. RSI helps traders determine when an asset is overbought or oversold.
How does RSI work? RSI measures the relative strength of price movements on a scale from 0 to 100:
- RSI value above 70 is considered an overbought zone, which may indicate a possible weakening of the trend and a downward correction.
- RSI value below 30 is considered an oversold zone, which may suggest that the asset is oversold and a potential upward reversal may occur.
Key Signals:
- Overbought: If RSI rises above 70, it may indicate that the asset is overbought and a potential downward reversal could occur.
- Oversold: If RSI falls below 30, it may indicate that the asset is oversold and a potential upward reversal could occur.
- Divergence: If the price moves in one direction and the RSI in another, this could signal an impending reversal.
Using RSI in Cryptocurrency Trading RSI can be used to identify entry and exit points in the cryptocurrency market. When combined with other indicators, such as Bollinger Bands, RSI helps traders make more informed decisions.
Strategy Examples:
- Buying in the Oversold Zone: If RSI falls below 30 and the cryptocurrency price approaches the lower Bollinger Band, this could be a buy signal.
- Example: If the RSI of Ethereum (ETH) falls below 30 and the price simultaneously approaches the lower Bollinger Band, this could indicate a potential upward reversal and be a good buying opportunity.
- Selling in the Overbought Zone: If RSI rises above 70 and the price approaches the upper Bollinger Band, this could be a sell signal.
- Example: If the RSI of Bitcoin (BTC) exceeds 70 and the price approaches the upper Bollinger Band, this could signal overbought conditions and a possible downward correction.
Advantages and Disadvantages of RSI
Advantages:
- Simplicity: RSI is easy to interpret and works well across different timeframes.
- Identification of Extreme Zones: Helps identify overbought and oversold zones.
- Divergences: Ability to detect hidden reversal signals through divergences.
Disadvantages:
- False Signals: In strong trends, RSI can remain in the overbought or oversold zone for a long time without leading to a reversal.
- Dependence on Period: The choice of period for calculating RSI can significantly affect the results, requiring adjustment to specific market conditions.
Conclusion RSI is a powerful tool that helps traders identify overbought and oversold conditions in the cryptocurrency market. However, like any other indicator, RSI is best used in combination with other technical analysis tools to improve signal accuracy. In the next article, we will explore the Moving Average Convergence Divergence (MACD) indicator, which combines the properties of trend and momentum indicators, helping to identify trend changes and their strength.
Don’t miss our next article on MACD—one of the most effective indicators for analyzing trends and changes in price movement strength in the cryptocurrency market.
If you missed the article on Bollinger Bands, be sure to read it to understand how this indicator helps analyze volatility and identify potential price reversal points.
