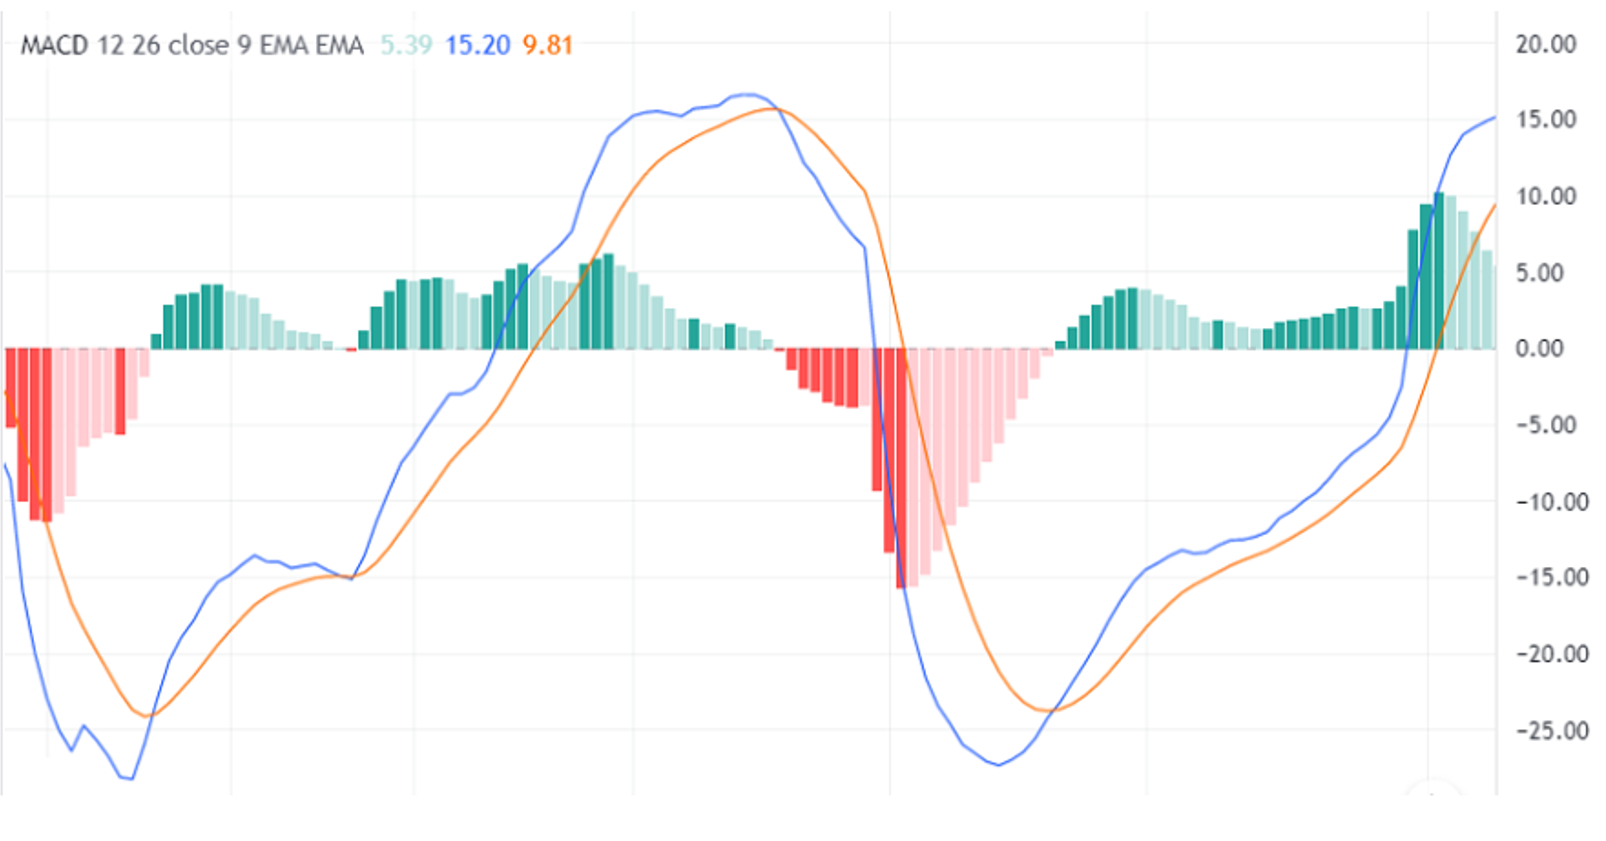
What is MACD? MACD (Moving Average Convergence Divergence) is a popular technical indicator used to analyze trends and their changes in the market. The MACD indicator combines the properties of both a trend indicator and an oscillator, allowing traders to determine the strength of a trend and the moments of its potential reversal.
Components of MACD:
- MACD Line: The difference between the 12-period Exponential Moving Average (EMA) and the 26-period EMA.
- Signal Line: A 9-period EMA of the MACD line.
- Histogram: The difference between the MACD line and the signal line. The histogram helps visualize the divergence and convergence between these two lines.
How does MACD Work? The MACD indicator helps traders identify moments when a trend is strengthening or weakening, as well as potential trend reversals.
Key MACD Signals:
- Crossing of the MACD and Signal Line: When the MACD crosses the signal line from below, it is a buy signal. When it crosses from above, it is a sell signal.
- Position Relative to the Zero Line: If the MACD is above the zero line, it signals an uptrend. If below, it signals a downtrend.
- Divergence: If the price moves in one direction and the MACD in another, this could be a signal for a reversal.
Using MACD in Cryptocurrency Trading MACD is a versatile indicator that can be used both for trend analysis and for finding entry and exit points in the cryptocurrency market.
Strategy Examples:
- MACD Line Cross: If the MACD crosses the signal line from below, this could be a buy signal.
- Example: If the MACD on the Bitcoin (BTC) chart crosses the signal line from below, it may indicate the start of an uptrend and be a buy signal.
- Divergence: If the price of Ethereum (ETH) is rising but the MACD starts to decline, this could indicate a weakening trend and a possible downward reversal.
Advantages and Disadvantages of MACD
Advantages:
- Versatility: MACD can be used both for trend analysis and for finding reversal points.
- Flexibility: It works well on various timeframes and for different assets, including cryptocurrencies.
- Visualization: The histogram makes it easy to track changes in trend strength.
Disadvantages:
- Lag: Like many indicators, MACD can give delayed signals.
- False Signals: In sideways markets, MACD can generate false signals.
Conclusion MACD is a powerful tool for analyzing trends and changes in price movement strength. It helps traders find the best moments to enter and exit trades, especially in volatile markets like the cryptocurrency market. However, like any indicator, MACD is best used in combination with other technical analysis tools to improve signal accuracy. In the next article, we will explore the Average True Range (ATR) indicator, which helps assess market volatility and determine stop-loss and take-profit levels.
Don’t miss our next article on the ATR (Average True Range) indicator—a tool that will help you better understand market volatility and manage risks in cryptocurrency trading.
If you missed the article on the Relative Strength Index (RSI), be sure to read it to understand how this oscillator helps identify overbought and oversold conditions in the market.
