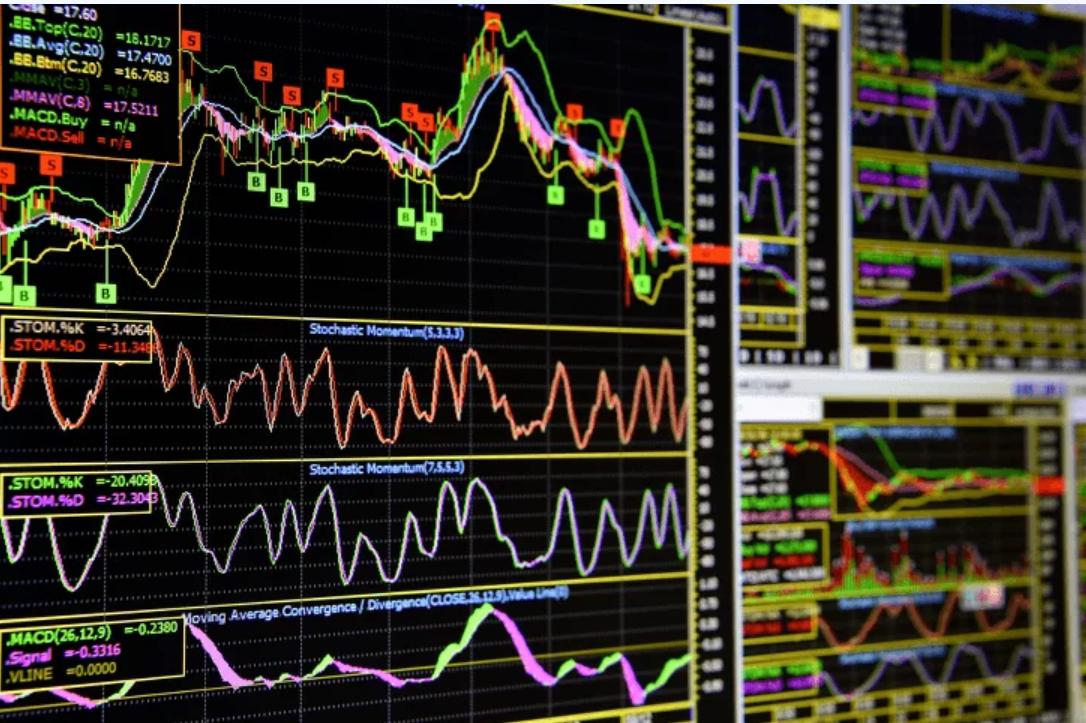
What are Technical Indicators? Technical indicators are mathematical calculations based on prices and trading volumes that traders use to analyze price movements and predict future trends. In cryptocurrency trading, indicators help identify buy or sell signals and determine entry and exit points.
Why are Technical Indicators Needed? The cryptocurrency market is characterized by high volatility and unpredictability. Technical indicators allow traders to assess current market conditions and make informed decisions. They help filter out market noise and avoid emotional decisions that can lead to losses.
Main Types of Technical Indicators Technical indicators can be divided into several main categories:
- Trend Indicators: Help determine the market direction. Examples: Simple Moving Average (SMA), Bollinger Bands.
- Momentum Indicators: Show the speed of price change. Examples: Relative Strength Index (RSI), Moving Average Convergence Divergence (MACD).
- Volatility Indicators: Measure the degree of price fluctuation. Examples: Bollinger Bands, Average True Range (ATR).
- Volume Indicators: Analyze trading volumes. Examples: Volume Weighted Average Price (VWAP), On-Balance Volume (OBV).
Key Concepts of Technical Analysis To successfully use technical indicators, it is important to understand basic concepts such as:
- Trend: The general direction of market price movement (upward, downward, sideways).
- Resistance and Support: Levels where the asset price encounters buying or selling pressure.
- Overbought and Oversold: Market states when the asset price has reached extreme levels, potentially leading to a correction or reversal.
- Divergence and Convergence: The divergence or convergence between price movement and an oscillator, indicating trend weakening or confirmation.
How to Use Technical Indicators? Technical indicators can be used individually or in combination with each other for more accurate signals. For example, a trend indicator can be used to determine the trend direction, while a momentum indicator can confirm entry signals.
Examples of Use:
- An upward trend confirmed by MACD and high trading volume can be a good signal for buying.
- If RSI indicates overbought conditions and the price approaches a resistance level, this could be a signal to take profits.
Conclusion Technical indicators are an essential tool in every cryptocurrency trader's arsenal. They help better understand market conditions and make informed trading decisions. In the following articles, we will take a closer look at some of the most popular indicators, such as SMA, Bollinger Bands, RSI, MACD, and ATR.
