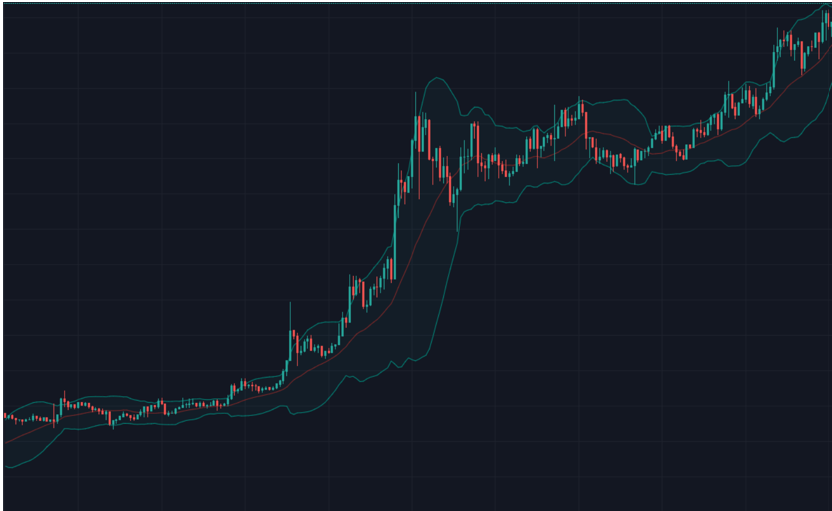
What are Bollinger Bands? Bollinger Bands are a technical indicator that helps traders assess market volatility and identify potential price reversal points. The indicator consists of three lines:
- Middle Line (SMA): A Simple Moving Average (usually 20-day), which serves as the basis for calculating the upper and lower bands.
- Upper Band: Located two standard deviations above the middle line.
- Lower Band: Located two standard deviations below the middle line.
How do Bollinger Bands Work? Bollinger Bands help traders visualize the degree of market volatility. When volatility is high, the bands widen, and when volatility is low, they contract. This indicator is useful for identifying possible price reversal points when the price reaches the upper or lower band.
Key Signals:
- Breakout of the Upper Band: If the cryptocurrency price rises above the upper Bollinger Band, it may indicate overbought conditions and a possible downward reversal.
- Breakout of the Lower Band: If the price falls below the lower band, it may signal oversold conditions and a potential upward reversal.
- Band Squeeze: When the bands contract, it signals reduced volatility and a possible sharp price movement in the future.
Using Bollinger Bands in Cryptocurrency Trading Bollinger Bands can be used for both trend trading and reversal trading.
Trend Strategies:
- Selling on a Breakout of the Upper Band: Traders might consider selling a cryptocurrency if the price significantly rises above the upper Bollinger Band, especially if confirmed by other indicators such as RSI.
- Example: If the price of Bitcoin (BTC) rises above the upper Bollinger Band and RSI shows overbought conditions, this could be a signal to take profits.
- Buying on a Breakout of the Lower Band: Buying may be appropriate if the price drops below the lower band and signs of oversold conditions are observed.
- Example: If the price of Ethereum (ETH) falls below the lower Bollinger Band and RSI shows oversold conditions, this might be a signal to buy.
Counter-Trend Strategies:
- Reversal Trading: Bollinger Bands are often used for reversal trading when the price approaches one of the bands and shows signs of reversal.
- Example: If the price of Ripple (XRP) reaches the lower Bollinger Band and starts to reverse upward, this could be a signal to open a long position.
Advantages and Disadvantages of Bollinger Bands
Advantages:
- Flexibility: Suitable for various timeframes and assets, including cryptocurrencies.
- Versatility: Works well in both trending and sideways markets.
- Visualization of Volatility: Provides a clear representation of market volatility changes.
Disadvantages:
- Lagging Indicator: Bollinger Bands are a lagging indicator, which may give delayed signals.
- False Signals: In sideways markets, Bollinger Bands can generate false signals.
Conclusion Bollinger Bands are a powerful tool that helps traders assess market volatility and identify potential price reversal points. In the next article, we will examine another important indicator—the Relative Strength Index (RSI), which helps evaluate the strength and speed of price changes.
Don’t miss our next article on the Relative Strength Index (RSI)—an indicator that will help you understand when the market is overbought or oversold and find the best entry and exit points. If you missed the article on the Exponential Moving Average (EMA), be sure to read it to understand how this basic indicator helps determine trends in the market.
